
Usage Guard Collector
Watch Cloudflare usage spikes with a small Worker, D1 dashboard and optional Slack or Discord alerts.
Usage Guard Collector is a self-hosted Cloudflare Budget Alerts alternative built on Cloudflare (D1, Workers). Free tier eligible within limits. Inspect the source and license in the linked repository.
Source & license
Upstream license: MIT
License TL;DR
You can use it, change it, self-host it and sell it. Keep the original copyright and license notice with copies of the code. You don’t have to publish your changes. The authors don’t promise it will work.
Explain MIT in plain English →Summary of the main license. Separate packages and assets can have different terms.
Inspect repository ↗Read this project’s actual license ↗Repository owner
See the upstream repository for the original creator and contributors.
Maintain this project? Maintainer verification →Cloudflare hosting
Free tier eligible within limits
A small monitored account and modest dashboard traffic can fit Workers Free and D1 Free allowances. Analytics access, dataset availability, database growth and CPU use must be checked; no zero-cost installation or bill was measured.
Hosting requirements
- One Worker Cron runs every six hours, for four scheduled runs and eight GraphQL requests per day, plus actual dashboard requests. Keep account-wide Worker traffic and CPU within the plan limits.
- Use your own D1 database. Free D1 allowances are account-wide: 5 million rows read/day, 100,000 rows written/day and 5 GB total storage. Indexes, repeated upserts and historical scans consume capacity.
- A few monitored resources and limited page views are the qualifying workload. The code has no retention pruning or GraphQL pagination; large or long-lived accounts need a separate capacity plan.
- The monitored account must expose the six requested analytics datasets and fields to its read token. GraphQL availability and limits vary by account and plan; this was not verified with a live account.
- workers.dev avoids a required domain purchase. Slack/Discord integrations and optional access protection have separate setup and service conditions. No required email, AI, R2, KV, Queue or Durable Object application service is provisioned.
Review findings & limitations
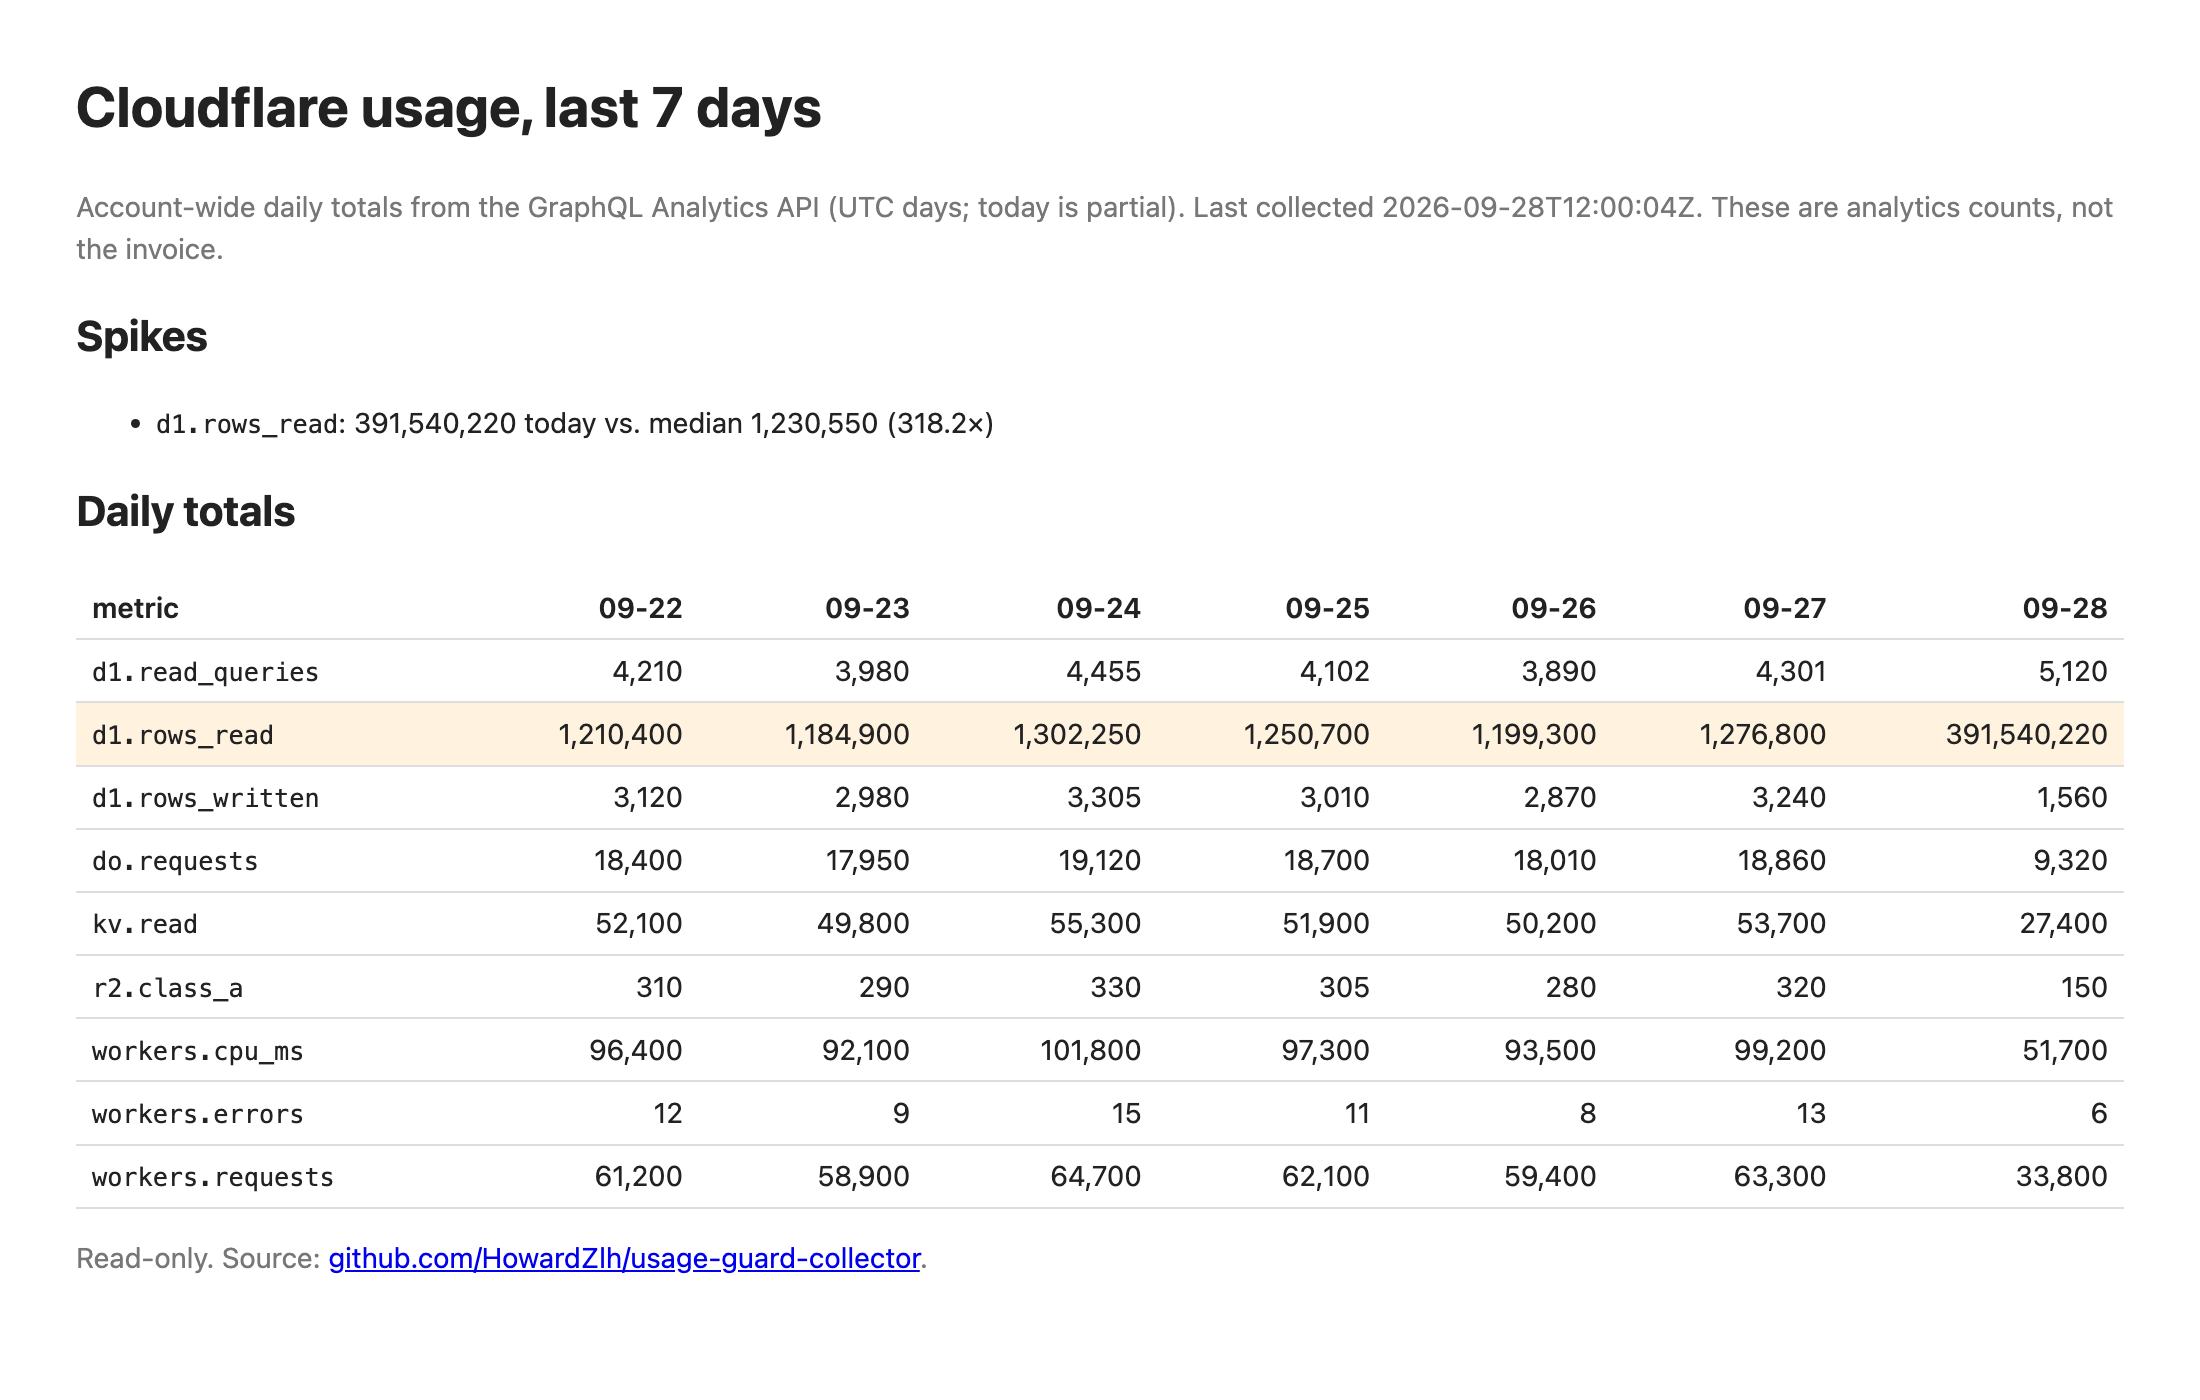
- The author-supplied screenshot shows the actual HTML dashboard with synthetic sample account data. It is not a capture of our account, a fresh installation or a measured production bill.
- The status page has no authentication. It exposes account-wide usage totals to anyone with its URL. Use your own access policy before exposing private usage; this review did not configure or test Access.
- Cloudflare analytics are usage counts, not invoice data or a spending limit. Neither this collector nor the compared Budget alerts feature stops workloads or caps charges.
- Only Workers and D1 are deployed. Durable Objects, KV, R2 and Queues are monitored datasets, not required application bindings.
- The combined GraphQL request asks for six datasets, each limited to 1,000 groups, without pagination. Dataset availability and field limits depend on the monitored account; check its settings and collection logs. A GraphQL error aborts that collection run.
- The collector refreshes yesterday and today; it does not backfill a complete historical week. Detection begins with the available preceding samples and skips metrics without a baseline. Missing days are not automatically filled with zero.
- Default spike floors reflect Workers Paid allowances and can be much too high for a Free account. Set THRESHOLDS_JSON for the workload being monitored; monitoring alone is not a quota-protection guarantee.
- D1 rows are stored per UTC day, product, metric and resource dimension, with no retention cleanup in the reviewed code. Storage, scans, index writes and large batches grow with account size and deployment age.
- Slack and Discord webhooks are optional. Failed targets are retried on subsequent runs; when one succeeds and another fails, the successful target can receive duplicates. No live delivery or concurrent-run test was performed.
- Create a separate Account Analytics Read credential for the single monitored account. The collector writes its own D1 history but does not call Cloudflare resource-management write APIs. Do not confuse the runtime read token with deployment credentials.
- Replace the placeholder D1 ID, apply the migration and set both required runtime secrets. CI checks and a dry-run are defined upstream; it does not deploy the Worker automatically. The hosted Usage Guard service is a waitlist, not a completed product.
Sources checked 01/10/2026
Repository snapshot: f9809bb. Hosting eligibility reflects the deployment documentation and listed assumptions.
- cloudflare-budget-alerts ↗
## Why watch Cloudflare usage instead of waiting for Budget Alerts?
- workers ↗
"main": "src/index.ts"
- d1 ↗
"binding": "USAGE"
- free-tier-eligible ↗
| **Free** | 100,000 per day | No charge for duration | 10 milliseconds of CPU time per invocation |
- free-tier-eligible ↗
| Rows read | 5 million / day |
- free-tier-eligible ↗
| Rows written | 100,000 / day |
- free-tier-eligible ↗
| Storage (per GB stored) | 5 GB (total) |
- free-tier-eligible ↗
"triggers": { "crons": ["0 */6 * * *"] }
- MIT ↗
MIT License Copyright (c) 2026 HowardZlh Permission is hereby granted, free of charge, to any person obtaining a copy of this software and associated documentation files (the "Software"), to deal in the Software without restriction, including without limitation the rights to use, copy, modify, merge, publish, distribute, sublicense, and/or sell copies of the Software, and to permit persons to whom the Software is furnished to do so, subject to the following conditions: The above copyright notice and this permission notice shall be included in all copies or substantial portions of the Software. THE SOFTWARE IS PROVIDED "AS IS", WITHOUT WARRANTY OF ANY KIND, EXPRESS OR IMPLIED, INCLUDING BUT NOT LIMITED TO THE WARRANTIES OF MERCHANTABILITY, FITNESS FOR A PARTICULAR PURPOSE AND NONINFRINGEMENT. IN NO EVENT SHALL THE AUTHORS OR COPYRIGHT HOLDERS BE LIABLE FOR ANY CLAIM, DAMAGES OR OTHER LIABILITY, WHETHER IN AN ACTION OF CONTRACT, TORT OR OTHERWISE, ARISING FROM, OUT OF OR IN CONNECTION WITH THE SOFTWARE OR THE USE OR OTHER DEALINGS IN THE SOFTWARE.
- architecture ↗
"triggers": { "crons": ["0 */6 * * *"] }
- architecture ↗
runCollect(env).then((s) => {
- architecture ↗
summary.written += await upsertRows(env.USAGE, toRows(date, account), collectedAt);
- architecture ↗
export const GRAPHQL_ENDPOINT = "https://api.cloudflare.com/client/v4/graphql";
- architecture ↗
const results = await notify(env, formatMessage(today, fresh), fetchImpl);
- architecture ↗
<h1>Cloudflare usage, last ${m.dates.length} days</h1>
Upstream screenshot · HowardZlh/usage-guard-collector repository contributors ↗. Depicts the upstream project. We have not deployed and tested a fresh installation here.
What it can replace
Compare the workflow you need. These mappings describe overlap; full feature parity requires a separate comparison.
 Cloudflare Budget Alerts ↗
An alternative approach to alerting on Cloudflare usage: it detects a large change in daily metrics and can notify Slack or Discord. Budget alerts track monetary billing thresholds and send email. The collector does not reproduce invoice totals, dollar budgets, email delivery or a kill switch; the two can be used together.
See supporting source ↗How it works
The shape of Usage Guard Collector on Cloudflare, and how it stacks up against the rented tools it replaces.
Architecture
Diagram of deployment declarations at the reviewed commit. Each app has its own entrypoint; declared resources do not prove runtime calls. Follow file and line sources below.
View upstream source ↗Configuration and workflow sources
Reviewed commit f9809bb41ba5. This configuration evidence comes from reading source files. Execution checks, when available, appear in the project's runtime review.
Deployment configuration · 1 file
Cloudflare Workers · compatibility 2026-09-01
usage-guard-collector · default
Entrypoint: src/index.ts
Cron triggers (UTC): 0 */6 * * *
USAGE→ D1
Named environments are separate deployments. Bindings are shown only where declared. Configured routes are URL patterns, not verified application endpoints.
Runtime source · handlers, binding usage and workflow steps
Observed TypeScript/JavaScript declarations from Worker entrypoints and resolved relative imports. Calls and workflow steps may run conditionally; their listed order is not a proven end-to-end request flow. Router declarations may be mounted under a prefix or may not be registered. This shows code wiring, not a successful deployment or runtime test. Dynamic wiring, aliases and generated code may not resolve.
- L24 · isoDate calls (conditional paths may differ): slice, d.toISOString
- L28 · addDays calls (conditional paths may differ): d.setUTCDate, d.getUTCDate, isoDate
- L43 · runCollect calls (conditional paths may differ): isoDate, now.toISOString, addDays, fetchUsage, upsertRows, toRows, loadTotals, buildSeries, spike, parseThresholds, filterUnnotified, notify, formatMessage, results.filter, results.every, markNotified, String
- L81 · renderIndex calls (conditional paths may differ): isoDate, addDays, loadTotals, buildSeries, spike, parseThresholds, first, env.USAGE.prepare, dates.push, renderPage, pivot, totals.filter
Environment references: env.CF_API_TOKEN · env.CF_ACCOUNT_ID · env.USAGE · env.THRESHOLDS_JSON
- L87 · fetchUsage calls (conditional paths may differ): fetchImpl, JSON.stringify, res.json, join, body.errors.map
- L135 · r2Class calls (conditional paths may differ): R2_CLASS_A.has, R2_CLASS_B.has
- L143 · kvMetric calls (conditional paths may differ): actionType.toLowerCase, KV_ACTIONS.has
- L149 · add calls (conditional paths may differ): acc.get, acc.set
- L157 · toRows calls (conditional paths may differ): add, kvMetric, r2Class, acc.values
- L6 · formatMessage calls (conditional paths may differ): spikes.map, s.today.toLocaleString, s.baseline.toLocaleString, formatRatio, lines.join
- L21 · post calls (conditional paths may differ): fetchImpl, JSON.stringify, String
- L40 · notify calls (conditional paths may differ): jobs.push, post, Promise.all
Environment references: env.DISCORD_WEBHOOK_URL · env.SLACK_WEBHOOK_URL
- L5 · escapeHtml calls (conditional paths may differ): replaceAll, s.replaceAll
- L13 · fmtNum calls (conditional paths may differ): Number.isInteger, n.toLocaleString
- L35 · faviconHref calls (conditional paths may differ): encodeURIComponent
- L43 · renderPage calls (conditional paths may differ): m.spikes.map, join, m.dates.map, escapeHtml, d.slice, sort, m.table.keys, metrics.map, m.table.get, fmtNum, byDate.get, spikeKeys.has, formatRatio, faviconHref
- L48 · parseThresholds calls (conditional paths may differ): json.trim, JSON.parse, Array.isArray, Object.entries, Number.isFinite
- L64 · median calls (conditional paths may differ): sort, Math.floor
- L86 · spike calls (conditional paths may differ): sort, Object.keys, median, out.push
- L106 · formatRatio calls (conditional paths may differ): Number.isFinite, ratio.toFixed
- L12 · upsertRows calls (conditional paths may differ): db.prepare, db.batch, rows.map, stmt.bind
- L32 · loadTotals calls (conditional paths may differ): all, bind, db.prepare
- L50 · buildSeries calls (conditional paths may differ): hist.push
- L65 · pivot calls (conditional paths may differ): m.get, byDate.set, m.set
- L76 · filterUnnotified calls (conditional paths may differ): all, bind, db.prepare, res.results.map, spikes.filter, seen.has
- L90 · markNotified calls (conditional paths may differ): db.prepare, db.batch, spikes.map, splitKey, stmt.bind
- L108 · splitKey calls (conditional paths may differ): key.indexOf, key.slice
Build and deployment pipeline · 1 GitHub Actions workflow
Repository CI declarations, separate from runtime request processing. Job dependencies and conditions are shown as written; long commands are shortened with an ellipsis; a workflow file does not prove a recent successful run.
Triggers: push, pull_request
test · no job dependencies declared
- actions/checkout@v4
actions/checkout@v4 - pnpm/action-setup@v4
pnpm/action-setup@v4 - actions/setup-node@v4
actions/setup-node@v4 - Shell command
pnpm install --frozen-lockfile - Shell command
pnpm lint - Shell command
pnpm typecheck - Shell command
pnpm test - Shell command
pnpm exec wrangler deploy --dry-run --outdir /tmp/ugc-dry
deploy: wrangler d1 migrations apply USAGE --remote && wrangler deploy
Repository README
View original on GitHub ↗Full upstream document by @HowardZlh · README.md · snapshot f9809bb
usage-guard-collector
Self-hosted Cloudflare usage spike alerts with a one-click deploy: a read-only Worker that watches D1 rows read, Durable Objects requests, KV, R2 and Queues, and pings Discord or Slack when today is 10x last week.
It pulls daily counts from the GraphQL Analytics API into your own D1 every 6 hours. One HTML page. MIT.
It never calls a Cloudflare write API. It cannot stop a Worker, delete a database or change a setting. The token you give it is Account Analytics Read and nothing else.
That's the whole UI. Sample data, not a real account.
Why watch Cloudflare usage instead of waiting for Budget Alerts?
Because Budget Alerts fire on the invoice total, and by then the meter has been running for days. Cloudflare's own docs call Budget alerts "informational only. They do not pause or cap usage."
I keep a public list of this year's Cloudflare bill spikes: Why Cloudflare bills spike: 8 D1 and Durable Objects cases from 2026. Seven are D1 rows read, one is a Durable Objects alarm loop. Amounts run from $176 to about $34,895.
If you'd rather see a number before deploying anything, the Workers pricing calculator prices a month of usage across D1, Durable Objects, KV, R2 and Queues. No login, and the result URL is shareable.
The shape is the same every time. One meter ran 10,000x above normal, and the first notification was the invoice or a quota email. One thread was 1.476 trillion rows read; another was a $5 subscription that grew to about $4,115 in a month.
The GraphQL Analytics API already has every number, per day, per resource. What was missing was a thing that reads them on a schedule, remembers last week, and says "this one is 500x yesterday" somewhere I will see it. This repo is that thing, and nothing more.
What it collects: Workers, D1, Durable Objects, KV, R2, Queues
Each row is one resource's metric for one UTC day. Dataset and field names were checked against the live schema by introspection on 2026-09-15 (src/graphql.ts).
| Product | GraphQL dataset | Metrics stored | Resource dimension |
|---|---|---|---|
| Workers | workersInvocationsAdaptive |
requests, errors, cpu_ms |
scriptName |
| D1 | d1AnalyticsAdaptiveGroups |
rows_read, rows_written, read_queries, write_queries |
databaseId |
| Durable Objects | durableObjectsInvocationsAdaptiveGroups |
requests |
scriptName |
| KV | kvOperationsAdaptiveGroups |
read, write, delete, list |
namespaceId |
| R2 | r2OperationsAdaptiveGroups |
class_a, class_b (per the R2 pricing page lists) |
bucketName |
| Queues | queueMessageOperationsAdaptiveGroups |
operations (billable) |
queueId |
These are analytics counts, not the invoice. Cloudflare's docs say the analytics datasets include traffic that billing excludes, so expect the numbers to sit a little above what you are charged for.
How a spike is detected: 10x the 7-day median plus a floor
spike(today, last7) in src/spike.ts is a pure function. A metric is flagged when today's account-wide total is at least 10x the median of the previous 7 days and also above an absolute floor for that metric.
The floor stops "3 requests vs 0 yesterday" from paging you. Defaults are 1% of the monthly included quota on Workers Paid (2026-09-15 pricing pages): d1.rows_read 250,000,000, do.requests 10,000, r2.class_a 10,000.
Override any floor with the THRESHOLDS_JSON var in wrangler.jsonc:
"vars": { "THRESHOLDS_JSON": "{\"d1.rows_read\": 5000000, \"kv.read\": 50000}" }
The first day after deploy flags nothing; there is no baseline yet. "Today" is a partial UTC day, so a spike shows up as soon as the running total crosses the bar, not at midnight.
One-click deploy to Cloudflare: one form, two secrets
The button above clones this repo into your GitHub or GitLab account, creates the D1 database, runs the migration and deploys the Worker. The form asks for two secrets: CF_ACCOUNT_ID (the 32-hex id in your dashboard URL) and CF_API_TOKEN (see "The API token" below). Everything else has a default.
Webhooks are not on that form. Add one afterwards with wrangler secret put DISCORD_WEBHOOK_URL or from the Worker's Settings page.
If your account already has a D1 named usage-guard, the form pre-selects it because the name matches. Pick "create new" unless you mean to share that table; I found this out by binding a test deploy to my live one.
Deploy to your own account in six commands
You need wrangler logged in to the account you want to watch (npx wrangler login), Node 22.5 or newer, and pnpm.
git clone https://github.com/HowardZlh/usage-guard-collector && cd usage-guard-collector
pnpm install
pnpm exec wrangler d1 create usage-guard          # paste the database_id it prints into wrangler.jsonc
pnpm exec wrangler secret put CF_ACCOUNT_ID       # the 32-hex id in your dashboard URL
pnpm exec wrangler secret put CF_API_TOKEN        # see "The API token" below
pnpm run deploy                                   # applies the migration, then wrangler deploy
Optional, after deploy:
pnpm exec wrangler secret put DISCORD_WEBHOOK_URL # or SLACK_WEBHOOK_URL, or both
The Cron runs at 00:00, 06:00, 12:00 and 18:00 UTC. To not wait, open the Worker in the dashboard and use the Cron trigger's "Run now". Or run it locally:
cp .dev.vars.example .dev.vars   # fill CF_ACCOUNT_ID / CF_API_TOKEN
pnpm exec wrangler d1 migrations apply USAGE --local
pnpm dev                          # then: curl "http://127.0.0.1:8787/__scheduled?cron=0+*/6+*+*+*"
The API token: Account Analytics Read and nothing else
Create a token that can read analytics and nothing else. In the dashboard:
- Profile (top right) → API Tokens → Create Token → Create Custom Token.
- Name it, e.g.
usage-guard-collector. - Permissions: one row, Account → Account Analytics → Read. No Zone row, no Workers / D1 / KV / R2 Edit rows.
- Account Resources: Include → the one account you are watching.
- Continue to summary → Create Token. Copy it once; it is not shown again.
The Worker reads it as env.CF_API_TOKEN and never logs it. The scheduled log line is a JSON object with counts and, if something failed, the HTTP status or GraphQL error message. No headers, no token.
The status page, and how to put it behind Cloudflare Access
GET / renders the last 7 days as one table (metric x day) plus the current spike list. Plain HTML string, no framework, no external scripts, noindex. Anything else is 404.
It has no login. If you would rather not have your usage table on a public URL, put the Worker behind Cloudflare Access: Zero Trust → Access → Applications → Add → Self-hosted, domain = your Worker's hostname, policy = your email. The Cron is unaffected by Access.
Does it fit in the Workers Free plan?
Yes. One Cron trigger (Free allows 5), 4 invocations a day, 2 GraphQL requests per run, a few dozen D1 rows written per run and one read per page view.
All of that is a rounding error inside the Free tier. The collector can watch a Paid account from a Free one.
What it does not do
No write operations of any kind (no kill switch). One account per deploy. No email. No auth on the page. No billing data.
If one of those is what you need, the "Hosted version" line below is the honest answer.
Tests: zero network, real migration
pnpm test        # vitest, coverage gate: lines >= 85%, branches >= 80% (currently 100 / 100)
pnpm typecheck
pnpm lint        # biome
Every fetch is stubbed (vi.stubGlobal) across success / empty / non-2xx. D1 runs on node:sqlite with the real migration.
Hosted version (waitlist)
Usage Guard is the half of this you might not want to run yourself: multiple accounts, e-mail, a stop switch. It is a waitlist page today, not a product; the form asks one question. guard.guushu.com
Questions and support
Questions about a deploy, a dataset that came back empty, or a spike that looks wrong: open a thread in GitHub Discussions. Threads there are indexed, so the next person with the same error can find the answer.
For anything that does not fit a thread, the Guush Studio Discord is here: discord.gg/kYTzwkmGW. It is small and mostly a changelog right now.
License
MIT. See LICENSE.
Frequently asked about Usage Guard Collector
What is Usage Guard Collector?+
Usage Guard Collector is a self-hosted Cloudflare Budget Alerts alternative built on the Cloudflare developer platform. Watch Cloudflare usage spikes with a small Worker, D1 dashboard and optional Slack or Discord alerts.
What does Usage Guard Collector replace?+
Usage Guard Collector is listed as an alternative to Cloudflare Budget Alerts. Compare the features and tradeoffs before migrating.
What Cloudflare primitives does Usage Guard Collector use?+
Usage Guard Collector is built on D1, Workers.
How much does Usage Guard Collector cost to run?+
A small monitored account and modest dashboard traffic can fit Workers Free and D1 Free allowances. Analytics access, dataset availability, database growth and CPU use must be checked; no zero-cost installation or bill was measured. One Worker Cron runs every six hours, for four scheduled runs and eight GraphQL requests per day, plus actual dashboard requests. Keep account-wide Worker traffic and CPU within the plan limits. Use your own D1 database. Free D1 allowances are account-wide: 5 million rows read/day, 100,000 rows written/day and 5 GB total storage. Indexes, repeated upserts and historical scans consume capacity. A few monitored resources and limited page views are the qualifying workload. The code has no retention pruning or GraphQL pagination; large or long-lived accounts need a separate capacity plan. The monitored account must expose the six requested analytics datasets and fields to its read token. GraphQL availability and limits vary by account and plan; this was not verified with a live account. workers.dev avoids a required domain purchase. Slack/Discord integrations and optional access protection have separate setup and service conditions. No required email, AI, R2, KV, Queue or Durable Object application service is provisioned. Check current Cloudflare pricing before deploying.
Is Usage Guard Collector open source?+
The upstream repository declares the MIT license. Read its terms at https://raw.githubusercontent.com/HowardZlh/usage-guard-collector/f9809bb41ba54beaa668c5eadb3d33c3875b99f0/LICENSE. Source code and contributor credit are available at https://github.com/HowardZlh/usage-guard-collector.
Community rating
No ratings yet. Tried this project? Share your experience.
One rating per verified account. You can change or remove yours. Accounts are email verified; use of the software is self-reported.
Discussion · 0
sign in to comment →